

Introduction
Methodology
Field site description
Field measurement method description
Results and discussion
Conclusion
Introduction
With the rapid pace of global urbanization, approximately 3.5 billion people currently live in urban areas, and this proportion was expected to reach 70% by 2050. The accelerating urbanization has brought about various environmental issues, with urban environmental problems being particularly prominent. Street space, as crucial urban infrastructure, not only serves transportation functions but also directly influences the urban microclimate environment. the concept of street space design has undergone a significant transformation in recent years (Wu, 2023). And traditional street design primarily focused on vehicular traffic efficiency, emphasizing solutions for traffic and parking issues (Woo, 2020). However, with the deepening understanding of sustainable development, people-oriented street space design has gained increasing attention, and researchers have begun to focus on how street spaces affect pedestrian comfort.
To deal with the microclimate issues in urban street spaces, researchers have conducted extensive studies in this field. Currently, research on urban street space microclimate employed various methods to collect data, including field measurements, commercial numerical models, miniature models, and self-developed models. Among these methods, field measurement holded an irreplaceable position in urban microclimate research due to its advantage in directly obtaining real environmental data. For example, Vuckovic et al. (2017) selected 13 urban morphology types in central Vienna and used bicycle-mounted weather stations for mobile measurements to collect locational meteorological data. Li et al. (2022) selected 20 observation points with different land use types in Wuhan, China, conducted fixed measurements during the summers of 2015-2017, and employed comprehensive thermal environment indicators to quantitatively evaluate thermal environment on summer days. Compared to numerical simulations, field measurements can more accurately reflect actual environmental conditions, providing more representative and reliable data, which is crucial for understanding the actual patterns of urban microclimate variations and improving street space environments.
This study focuses on central Busan, employing field measurement to systematically investigate the microclimate characteristics of street spaces with different orientations during heatwave periods in summer. Special attention was given to examining the regulatory effects of street tree on microclimate parameters, aiming to provide scientific evidence for improving urban street environments and enhancing the quality of pedestrian spaces.
Methodology
Field site description
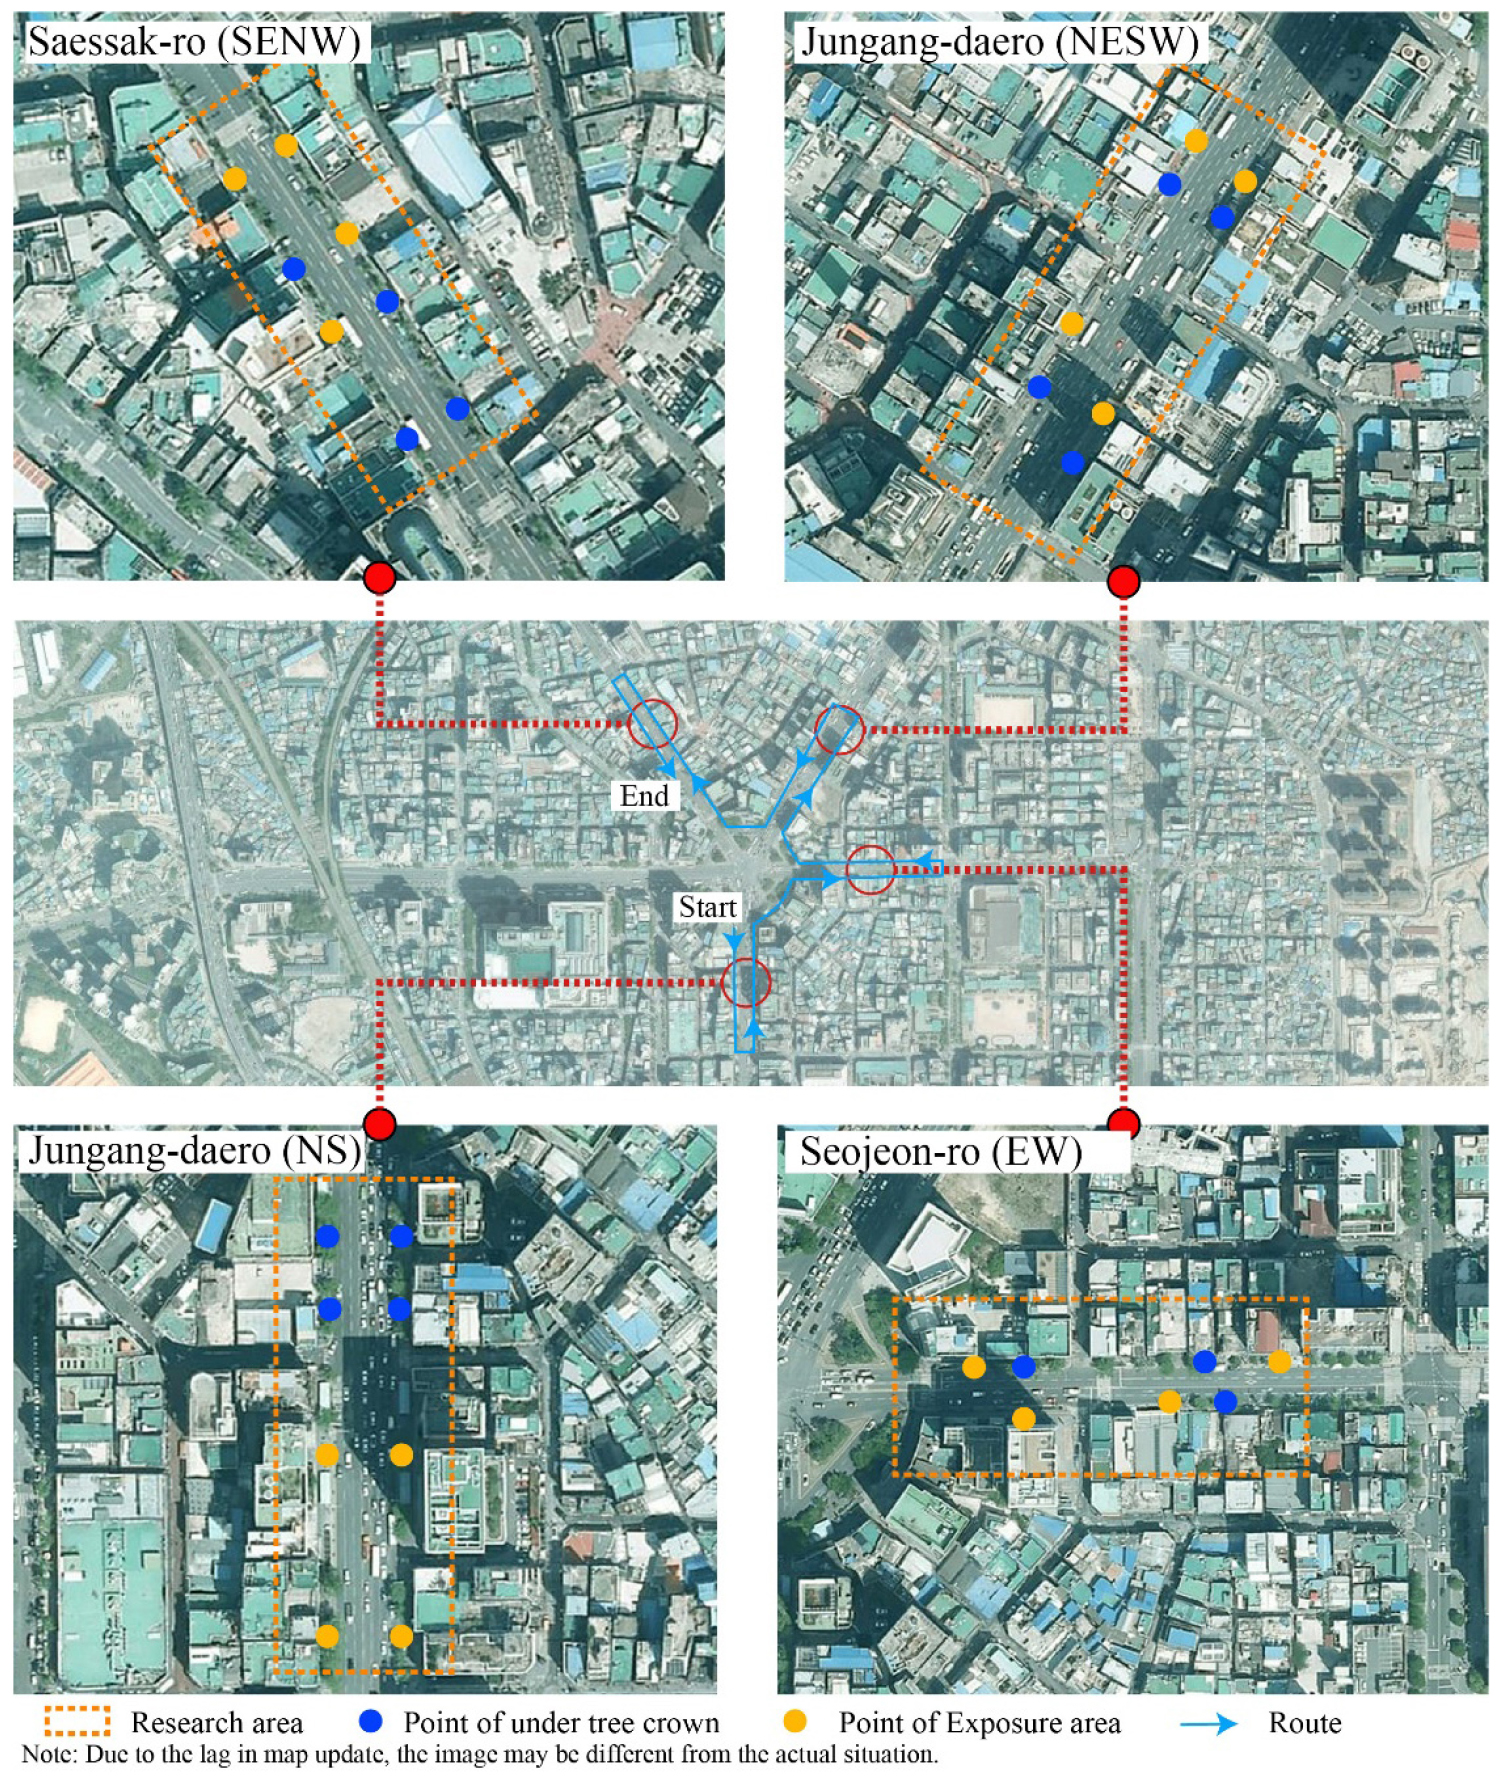
Most existing field measurement studies focus on only one or two street orientations’ microclimate characteristics, with few studies conducting simultaneous field measurements of four street orientations (Wu et al., 2022; Wu et al., 2024). This study selected a research area containing streets in four different orientations within the same district to minimize the impact of climate and topographical variations on the results. As shown in Figure 1, eight measurement points were established along each street direction, with four points on each side of the street. To examine the effects of different street orientations (SENW, NESW, NS, and EW) and street trees while controlling for the influence of height-to-width ratio (HB/WS), measurement points were established in both high and low HB/WS areas within each street orientation. At each HB/WS level, where street trees were present, one point was placed under the tree canopy (blue points) and another outside the canopy (yellow points). It should be noted that street with HB/WS greater than 1.1 were classified as high HB/WS, while those HB/WS with less than 1.0 were considered low HB/WS in this study. The high HB/WS typically featured tall buildings on both sides with relatively narrow street width, while low HB/WS were characterized by lower building heights with wider street width. However, no measurement point was established under the tree canopy in the high HB/WS area of the E-W street due to the absence of street trees.
Field measurement method description
This study utilized Testo measurement equipment for meteorological data collection. As shown in Table 1, TA and RH sensors were connected to the data logger via Bluetooth for data acquisition, while WVEL was recorded manually. The mobile weather station was mounted on a mobile cart at a height of 1.4-1.6 m above ground as shown in Figure 2. Measurements were conducted without interfering with pedestrian traffic and commercial activities. “Stop-and-Go” method is the conventional traverse measurement method with mobile weather stations on vehicles (Oke et al., 2017). The measurement cart moved quickly between points and stopped for one minute at each location to allow sensor readings to stabilize. The data recorded after one minute of stabilization at each point was used for analysis. This process was repeated across all 31 measurement points in the study area, ensuring that each complete measurement cycle was finished within one hour.
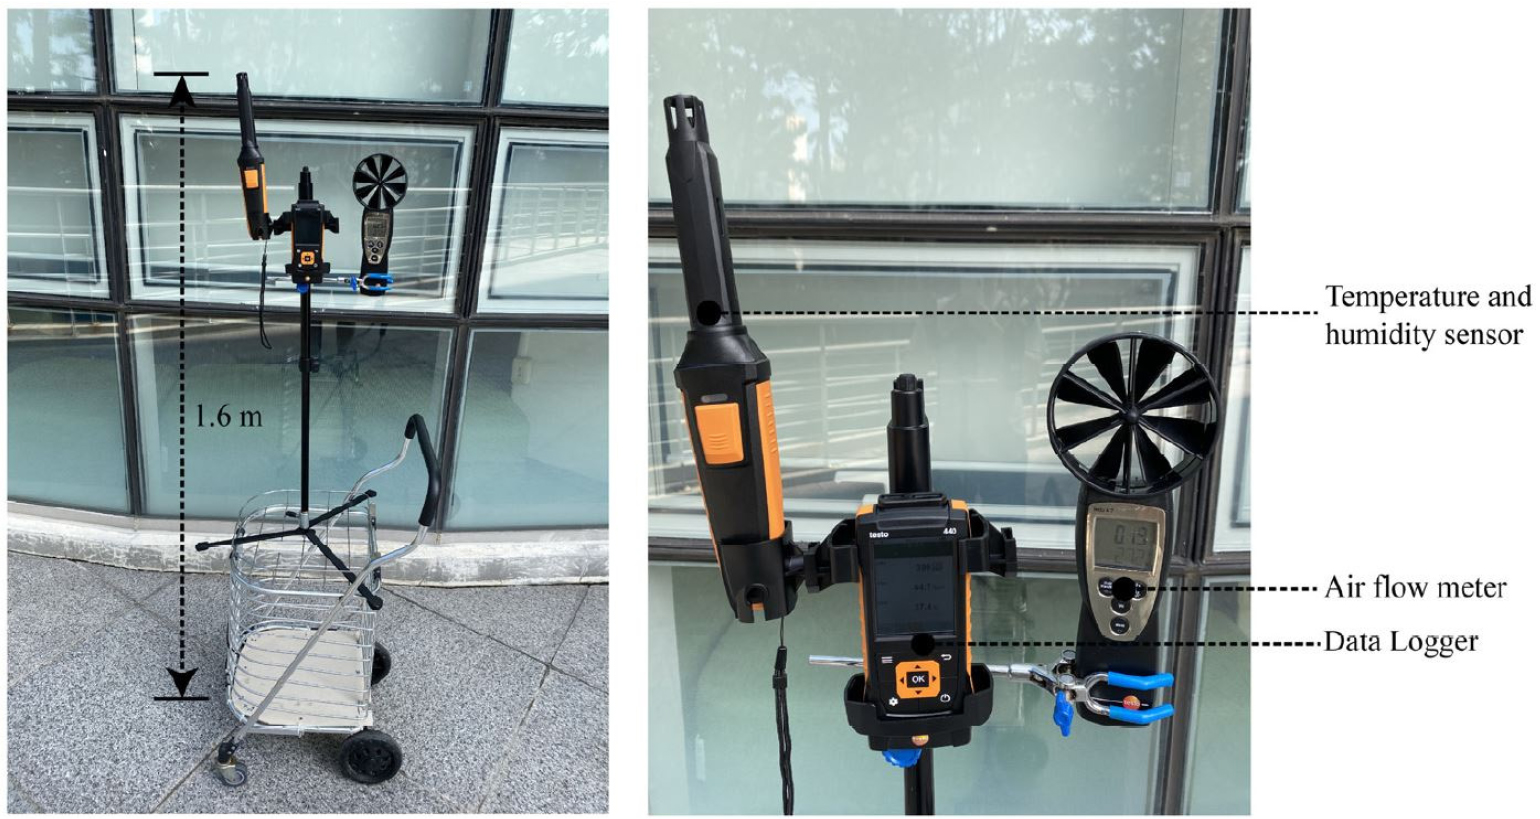
Table 1.
Parameters of Testo equipment
Field measurements were conducted on August 7, 2022, from 05:00 to 21:00, under clear sky conditions with minimal cloud cover. The study focused on three representative periods during the day: 05:00-06:00, 13:00-14:00, and 20:00-21:00. These periods were selected because they represent distinct microclimatic conditions: 05:00-06:00 captured the lowest TA, 13:00-14:00 represented the period of maximum solar radiation, and 20:00-21:00 reflected urban heat island characteristics. To ensure data quality, all instruments were calibrated before each measurement session to maintain measurement accuracy. For data processing, the raw data was screened for outliers, and measurements recorded after one minute of stabilization at each point were used as valid data for that location.
Results and discussion
As shown in Figure 3, the weather station data for the Seomyeon area of Busan on August 7, 2022, indicated that the TA reached its minimum (approximately 27℃) around 05:00-06:00, then gradually increased to its peak (approximately 32℃) between 13:00-14:00, before beginning to decline. The RH showed an inverse pattern to TA, reaching its maximum (approximately 95%) around 05:00-06:00 and dropping to its minimum (approximately 75%) during 14:00-15:00. After 16:00, the TA decreased significantly and stabilized at around 28℃ by 21:00, with RH showing the opposite trend.
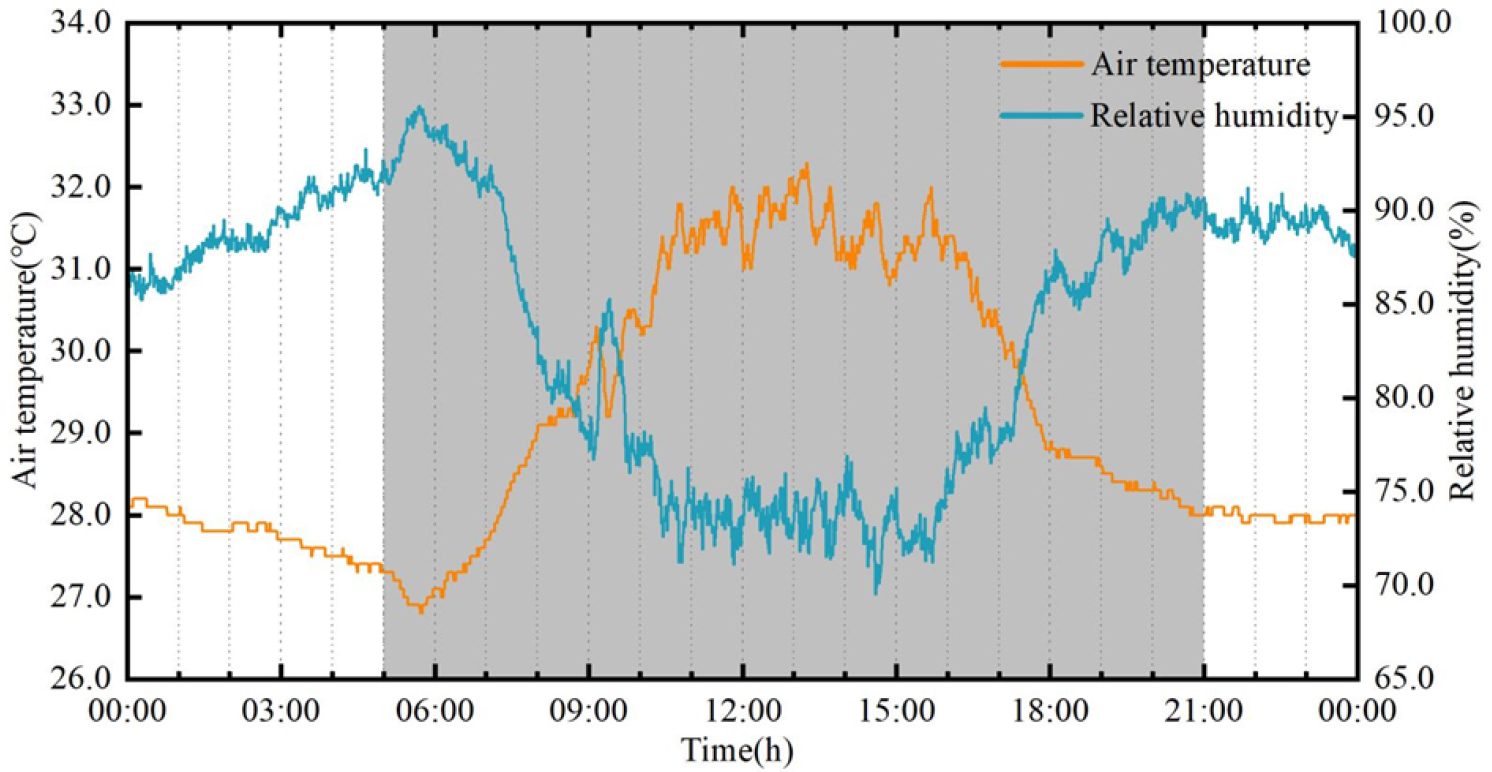
Table 2 presents a comparison between the measured data and weather station data for three representative periods. The measured TA were consistently higher than weather station, with TA differences of +1.3℃ at 05:00-06:00, +2.8℃ at 13:00-14:00, and +2.1℃ at 20:00-21:00. Both RH and WVEL were generally lower than weather station data, with RH differences of -10.7 percentage points, -17.7 percentage points, and -15.0 percentage points, and WVEL differences of –1.8 m/s, -4.9 m/s, and –4.4 m/s, respectively.
These differences primarily result from the unique environmental characteristics of street spaces: first, street spaces featured large areas of artificial surfaces and limited green spaces, combined with anthropogenic heat sources such as vehicles and mechanical equipment, leading to increased TA and decreased RH; second, surrounding buildings significantly influence the local wind environment through sheltering and channeling effects, reducing natural ventilation and further intensifying the high TA, low RH conditions. These findings align with Liu et al. (2018), who demonstrated that buildings significantly modify their surrounding wind environment.
Table 2.
Comparison between the measured data and weather station data for three representative periods
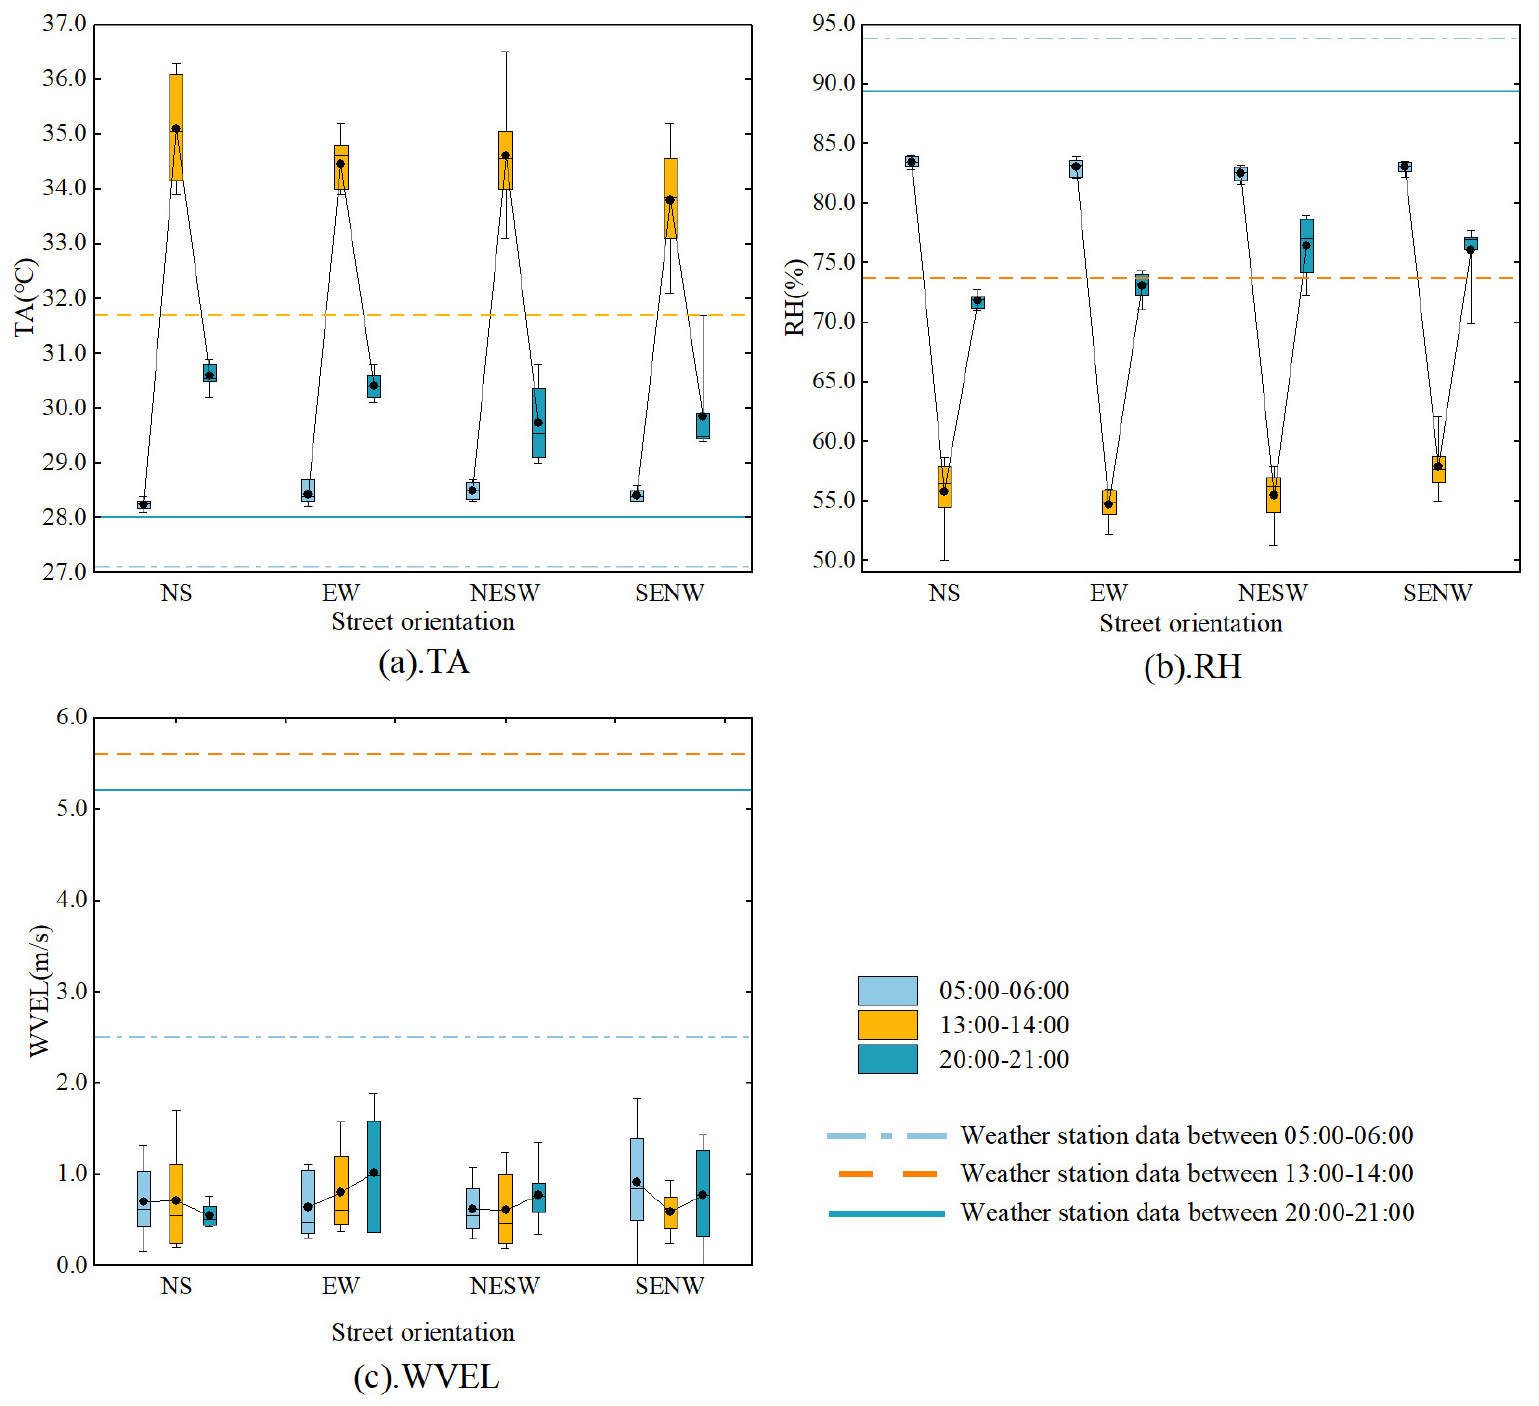
Figure 4 compares TA, RH, and WVEL across three representative periods. Except for WVEL, differences among the four street orientations were minimal during 05:00-06:00, with slightly increased variations during 20:00-21:00 due to heat release from artificial surfaces. The greatest differences in all parameters across street orientations occurred during 13:00-14:00 due to solar radiation effects. The NS street, with its lower building heights and smaller tree canopy coverage resulting in limited shading, recorded the highest average TA of 35.1℃ during 13:00-14:00. The NESW street had substantial building shade before 13:00, while the EW street, despite having lower building heights on its southern side, maintained similar average TA to NESW street due to extensive tree canopy shading, though the NESW street showed greater TA variations. The SENW street recorded the lowest average TA of 33.8℃, benefiting from extensive shading provided by high-rise buildings at its southeastern entrance and dense street trees and shrubs. RH variations showed an inverse relationship with TA. Due to its instantaneous and random nature, WVEL was not influenced by solar radiation. However, a pattern was observed where when WVEL peaked in one direction, it was lowest in the perpendicular direction, while remaining moderate in the other two directions. For example, during 05:00-06:00, when WVEL was highest in the SENW street, it was lowest in the perpendicular NESW street.
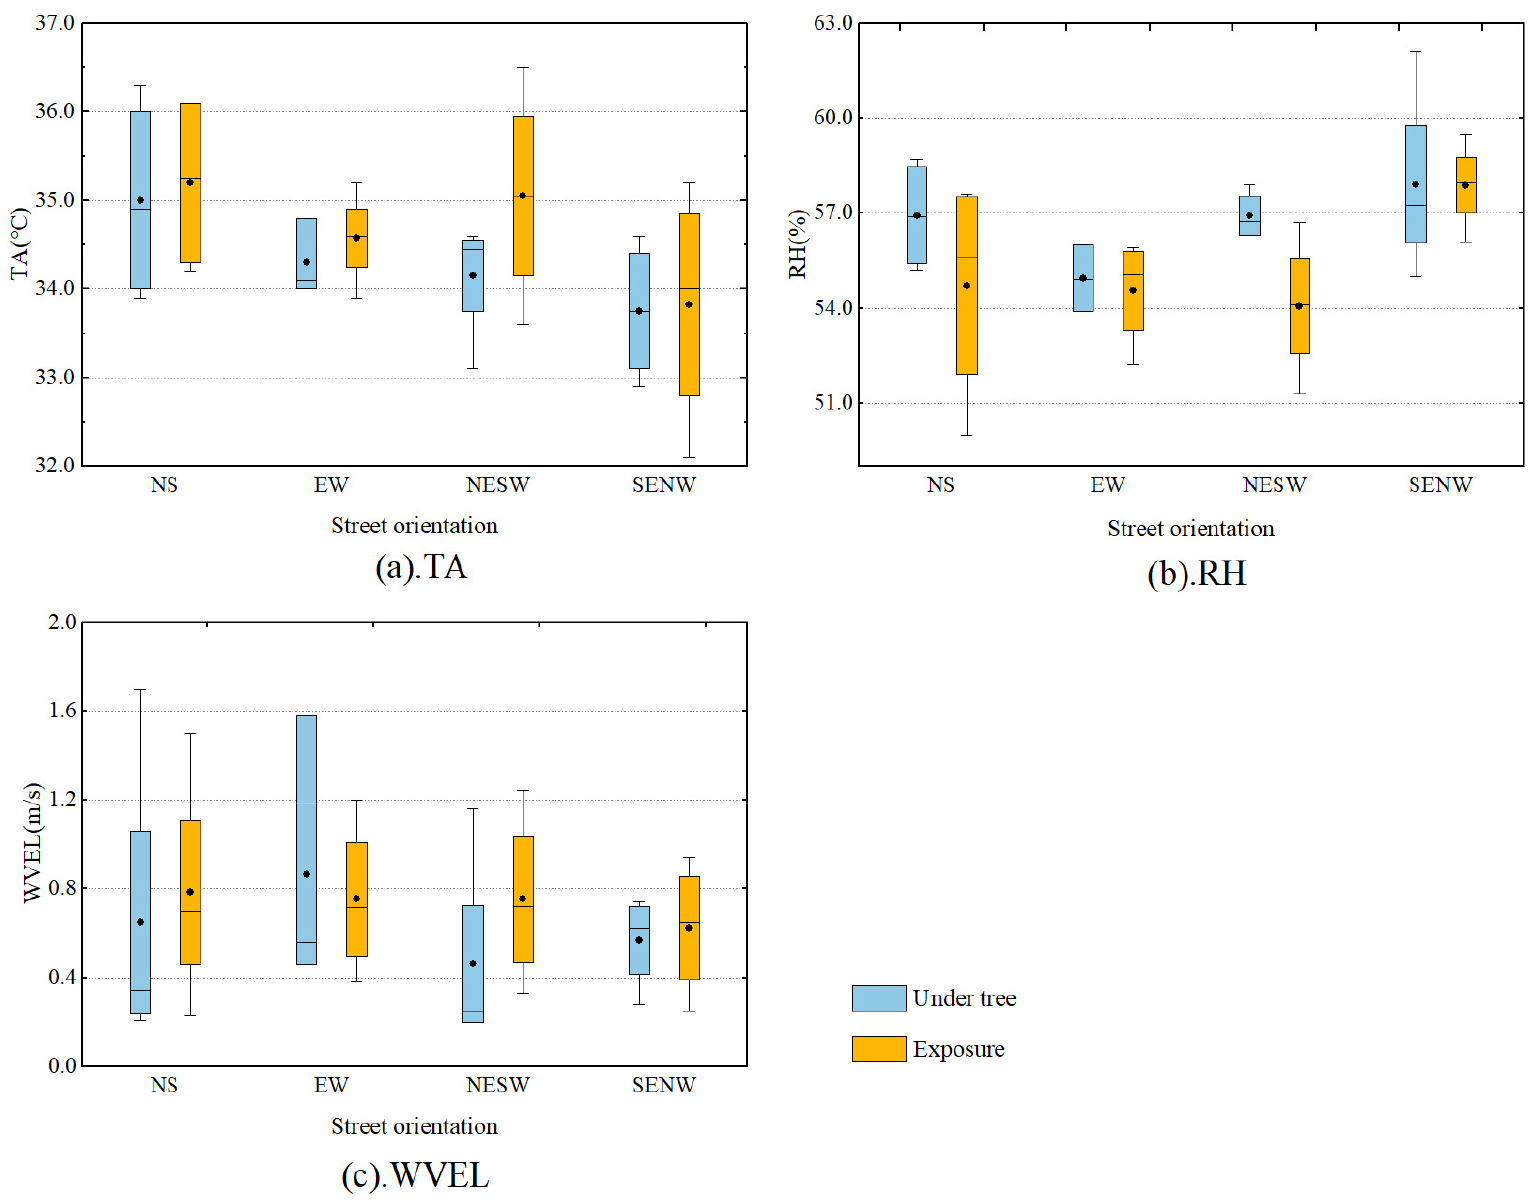
As microclimate parameters showed the most significant variations during the 13:00-14:00, this section focused on analyzing the impact of street trees on microclimate during this time frame (Figure 5). The results indicated that street trees had minimal effect on TA in NS and SENW streets, while in NESW streets, where solar radiation exposure was greatest, the tree canopy played an important role in radiation absorption. Notably, while TA differences in NS street were minimal, RH variations were more pronounced. Regarding WVEL, the presence of street trees created differences of up to 0.4 m/s in EW street and 0.3 m/s in NESW street. These findings are consistent with studies on street tree effects conducted in Nanjing and Wuhan, China.
Conclusion
This study systematically investigated the microclimate characteristics of urban street spaces using field measurement method, The findings reveal significant differences between street space microclimate and weather station data, particularly during 13:00-14:00, with measured TA being 2.8℃ higher and RH 17.7 percentage points lower, reflecting the unique microclimatic characteristics of urban street spaces. The microclimatic differences among streets with different orientations were most pronounced during 13:00-14:00, with NS street showing the highest average TA (35.1℃) and well-shaded SENW street recording the lowest (33.8℃). Additionally, street trees were found to modify the street space microclimate by reducing TA and altering local wind environments, with trees creating wind velocity differences of approximately 0.3-0.4 m/s in certain street orientations by reducing wind speeds beneath their canopies.
In this study, although the measurements were conducted in a specific area of Busan during a single summer day, which may limit the representation of microclimate characteristics in other urban contexts, the findings still provide valuable practical implications for urban planning and design. The significant variations in microclimate across different street orientations can inform orientation-specific design strategies. These insights contribute to developing more climate-responsive urban design guidelines and improving pedestrian comfort in street spaces.
